2026 · Creator
Aeris Forecast
A personal weather pipeline for pilots and crews — multi-resolution gridded forecasts, PostGIS queries, and a map you can actually read at 30,000 feet.
- lookahead at 1 km grid
- 60 min
- lookahead at 1 km grid
- stacked weather layers
- 4
- stacked weather layers
- tile response, p95
- 2.1 s
- tile response, p95
Reactions
Every aviation weather tool I used showed the same picture: a beautiful isobar map that answers "what is the weather" but never "can I fly this corridor now, and where exactly would it get dicey."
Aeris is my attempt at the second question — a personal pipeline that turns public gridded forecasts into a decision surface for pilots and field crews.
Pipeline
Four moving parts, deliberately boring:
- Ingest — pull model runs (wind, temp, precip, ceiling) on schedule.
- Reshape — regrid to multi-resolution storage. Wind shear wants fine cells; pressure gradients don't. Same idea as the thesis quadtree, applied to weather.
- Query — a PostGIS layer that answers "along this polyline, when does any threshold break?" in one round trip.
- Show — a MapLibre client that paints risk, not raw variables.
SELECT segment, time,
       max(wind_gust)  AS gust,
       ceil(min(ceiling)) AS floor
FROM aeris.enroute
WHERE flight_id = $1
GROUP BY segment, time
HAVING max(wind_gust) > 22 OR min(ceiling) < 1000;
What it taught me
- Public weather data is a solved problem; legibility is not.
- P95 tile latency is a UI feature. People forgive slow models, not slow maps.
- Multi-resolution storage makes "is this flight legal and wise right now" cost one query instead of a dashboard scan.
Status
Runs quietly on a small box, mostly for me and a few pilot friends. If the geospatial or simulation side of this interests you — or you have a corridor worth testing — say the word.
Related work
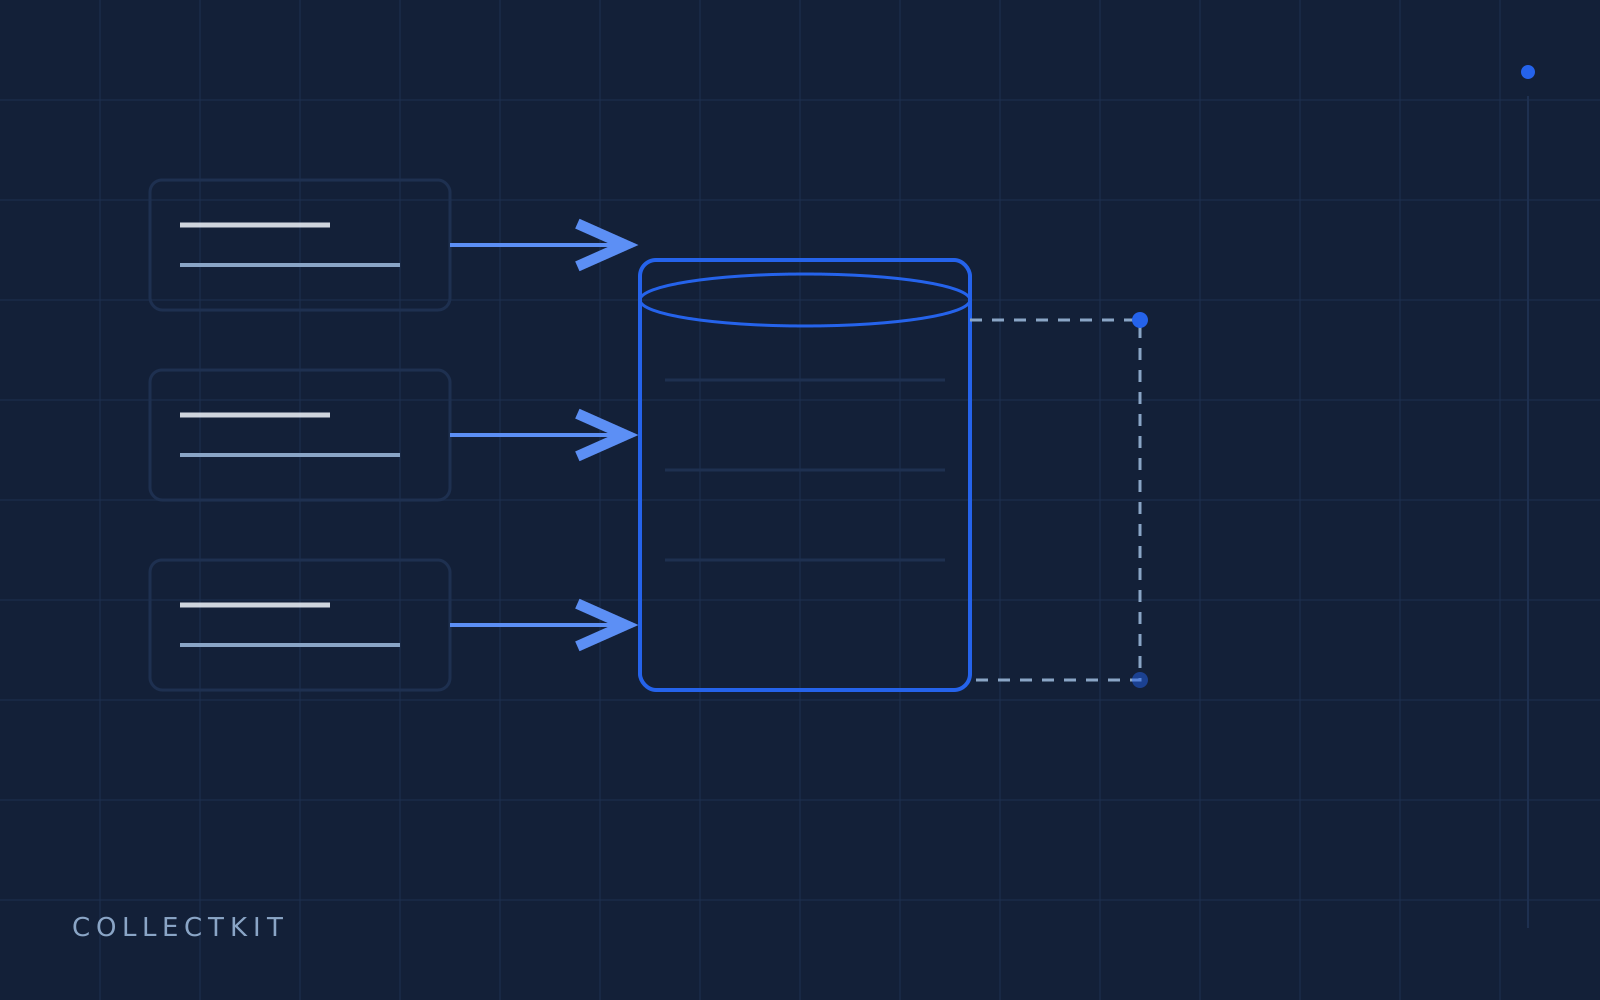
CollectKit
Field data collection that works where the signal doesn't — offline-first capture, typed schemas, instant sync.
Expo / React Native / FastAPI / PostgreSQL / PostGIS
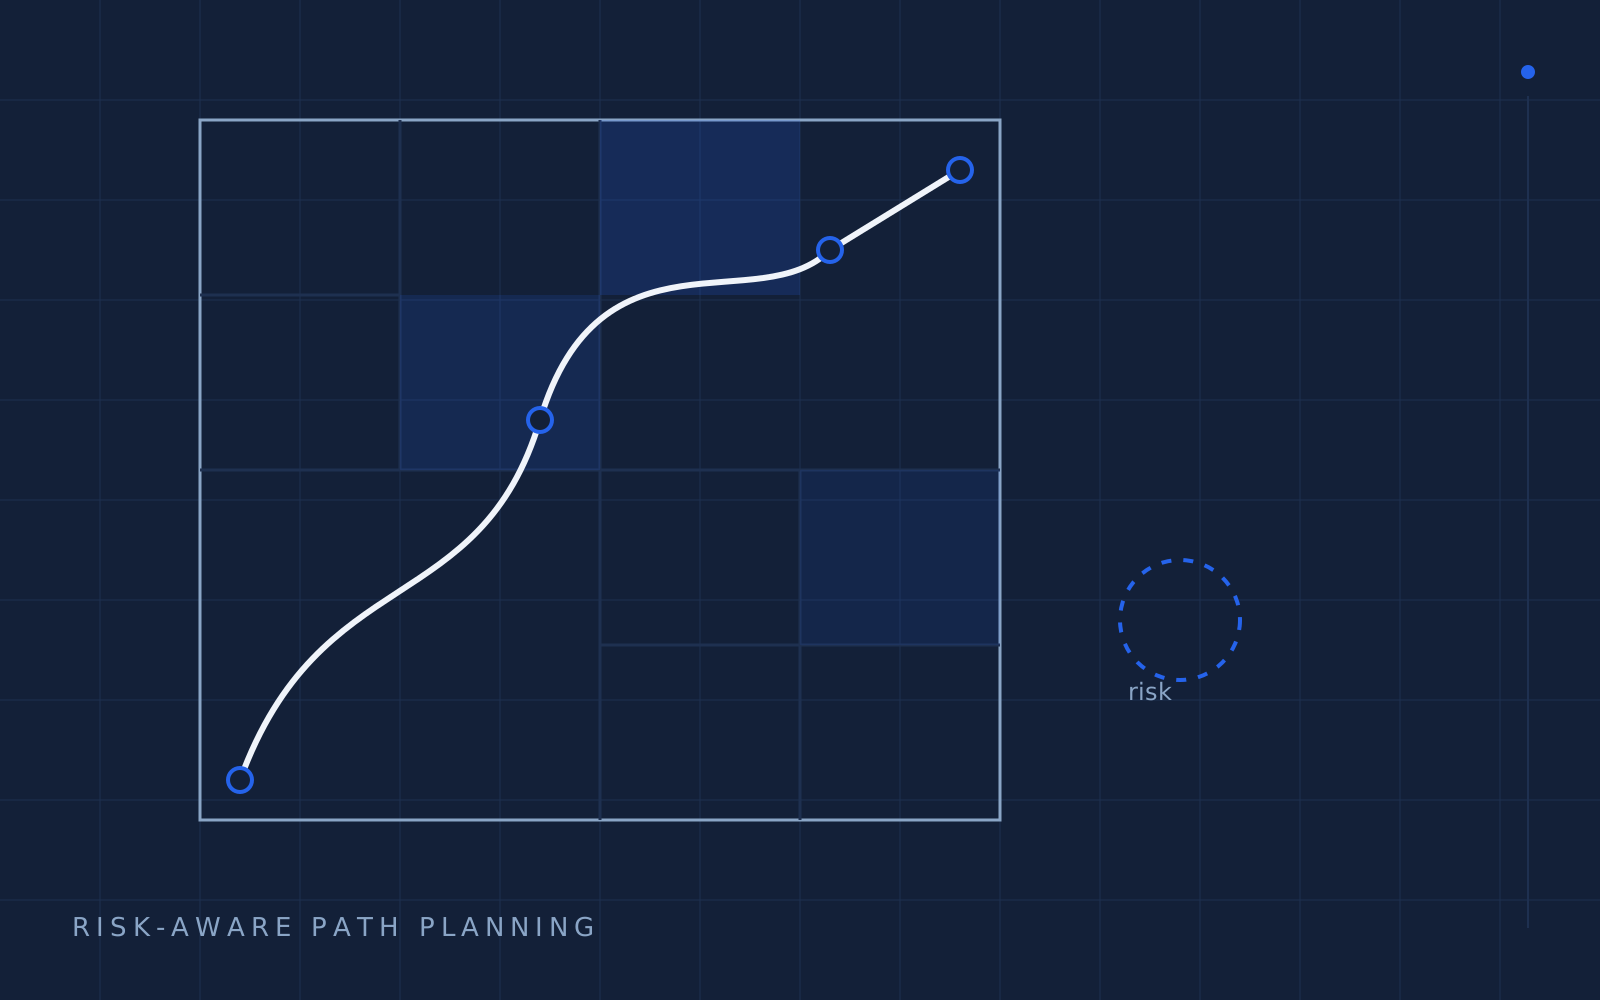
Risk-Aware Path Planning
Multiresolution UAV risk-map path planning — a layered quadtree, risk-aware A*, and a simulator built for a master's thesis.
Python / Cesium / Unity3D / NumPy