· 2 min read
Path planning, explained with a napkin
A* finds the best route for the numbers you give it. Risk-aware planning asks how much you should trust those numbers.
Reactions
The fastest way to understand autonomy research is to stop trusting the word "optimal." Here's the whole idea of my master's thesis, at napkin resolution.
The grid is the point
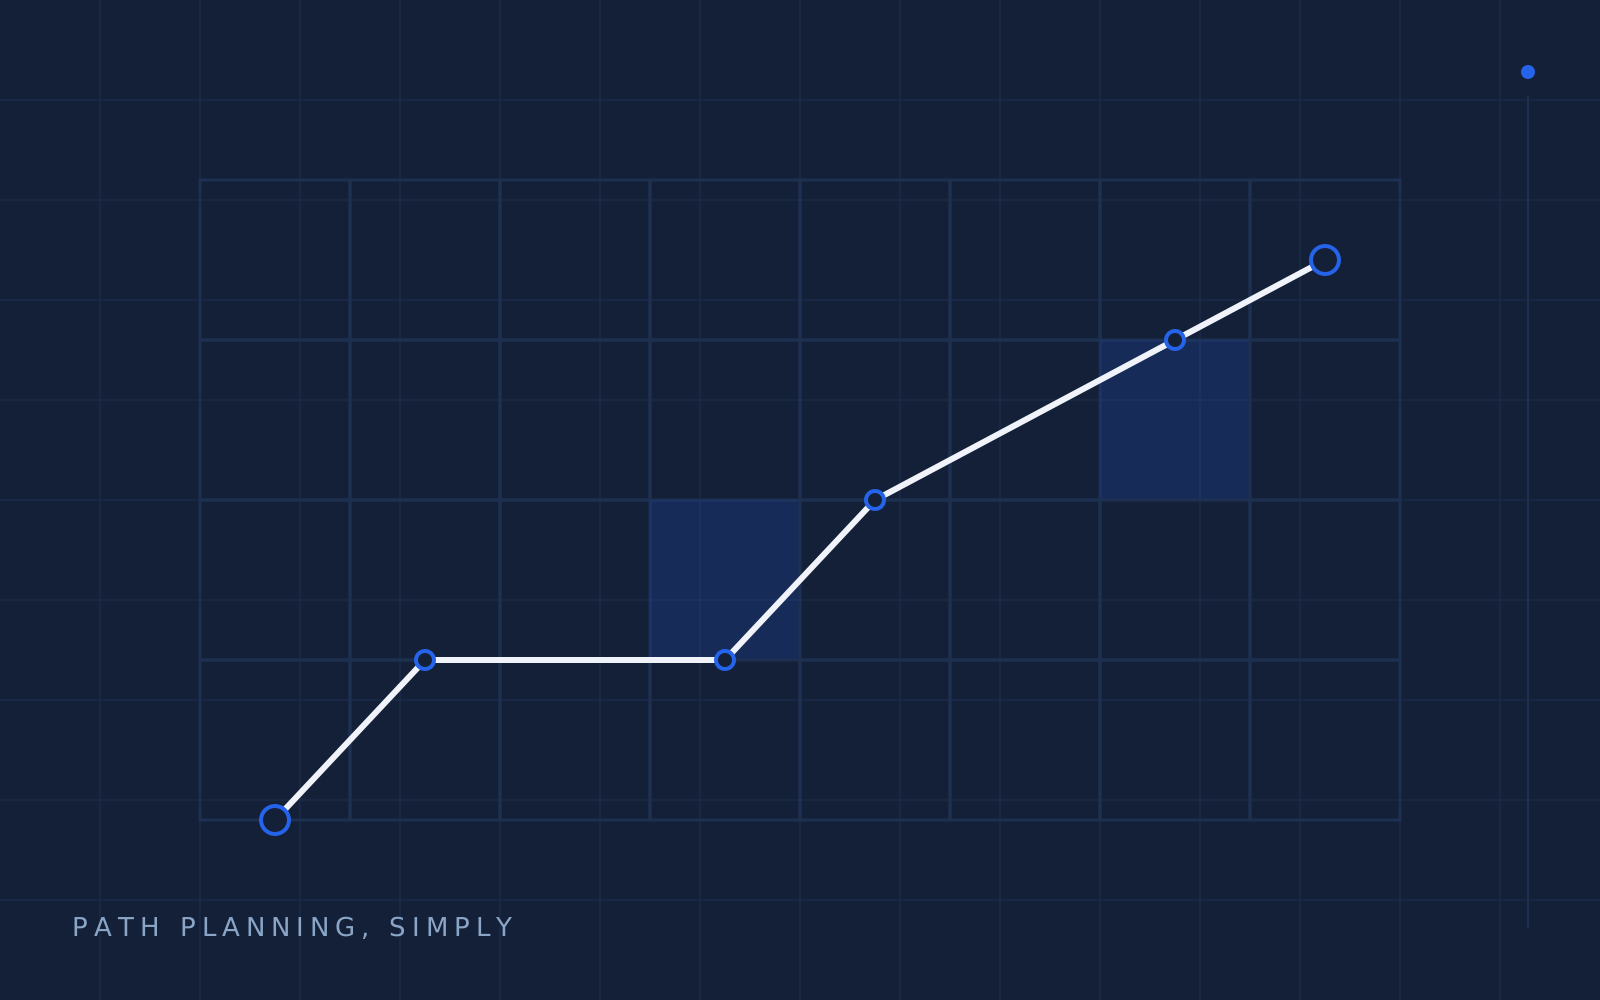
Picture a city map as graph paper. Every square has a cost. A* works the way a careful planner would: it keeps a queue of partial routes and always extends the one whose estimated total — what you've spent so far plus a hopeful guess about the rest — looks cheapest. When it reaches the destination, the route is provably optimal for the numbers you fed it, as long as those hopeful guesses never overestimate what's left. That last condition is the whole thing. The estimates are only as honest as the map.
# the honest version: cost is not distance
def cell_cost(cell, aircraft):
    risk = risk_model[cell.resolution].interval  # mean AND confidence
    return (
        cell.distance
        + risk.mean * aircraft.time_in_cell
        + risk.width * aircraft.caution_weight   # the "I might be wrong" term
    )
That last line is where every real deployment lives. The risk is an interval, not a point, because a map is always coarser than the world.
Where the grid lies
Uniform grids lie in two directions at once:
- Over boring fields, they pretend to know more than they do (and burn compute per square kilometre).
- Over stadiums, they pretend to know less than they do — one "medium" cell averaged from an empty parking lot and a full crowd.
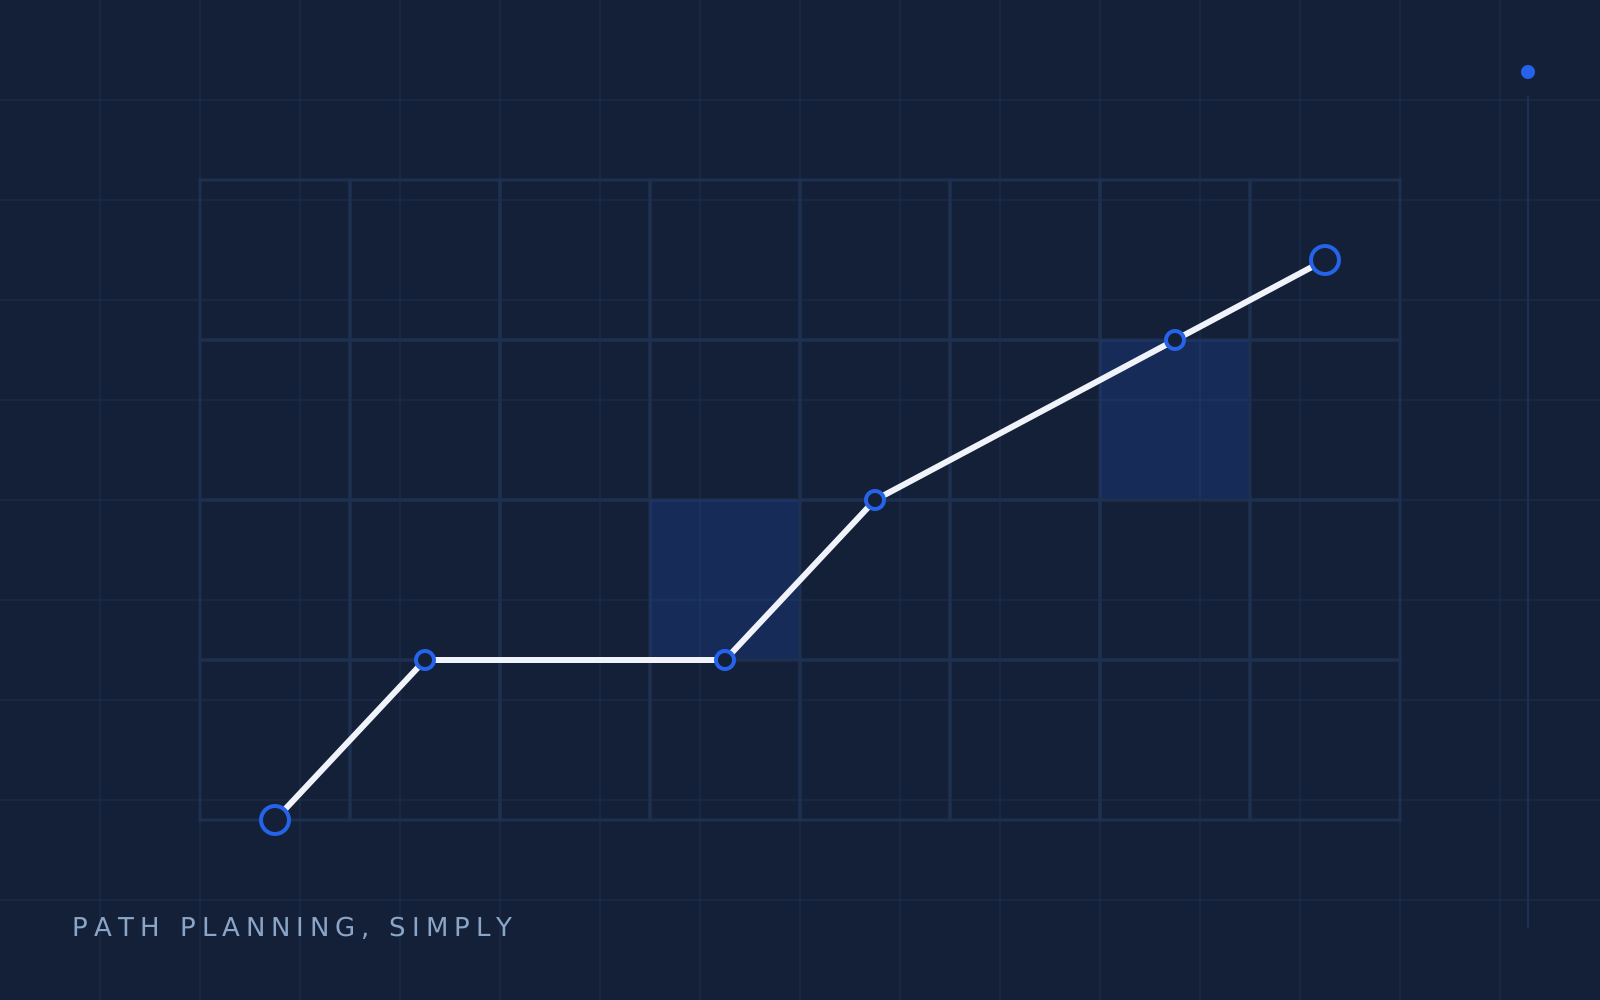
The fix is a layered quadtree: subdivide where consequence lives.
The part that surprised me
The 27,000-route simulation did not prove risk-aware routes are safer in a way a statistician could point at. It proved they are explainable. When a route bent 800 metres around a school at 3 p.m. and cut the corner at 6 a.m., every reviewer — pilots, regulators, engineers — read the intent off the shape. The planner had become legible.
That's the transferable lesson for anyone building AI systems that people have to trust: optimality wins the demo; legibility wins the deployment.
The long version, with all the math I skipped, is the thesis. The five-minute version is the project page.